NTC Refrigeração
IoT refrigeration monitoring platform for retail chains: performance analysis, alarm center and mobile app, from scope to code
- My role
- UX/UI Designer · Full Stack Developer
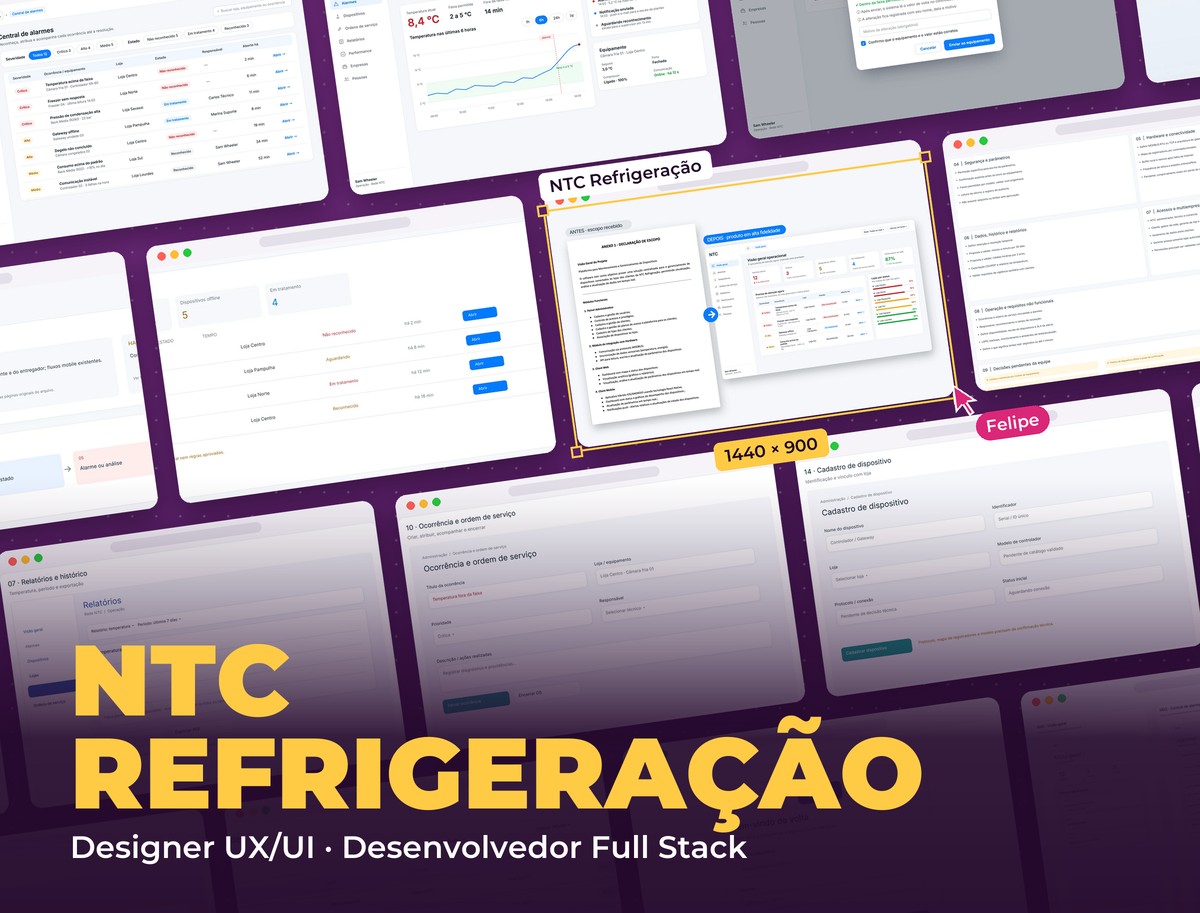 NTC Refrigeração
Context
NTC Refrigeração installs and maintains refrigeration systems for store and supermarket chains. The platform centralizes the devices connected to clients' stores to view, analyze and adjust data in real time. I did the UX/UI for the whole product and the full stack development.
- Client
- NTC Refrigeração
- Category
- IoT · Refrigeration
- Roles
- UX/UI Designer, Full Stack Developer
- Stack
- Next.js, React Native, NestJS, PostgreSQL, TimescaleDB, MQTT
Challenge
A refrigeration system produces hundreds of variables per store, and operators need to know within seconds what is out of range. The challenge was to turn that density into quick reading without hiding the technical detail engineers need, and to complete a scope that didn't define alarms, write permissions, connection loss, data retention or per-company access roles.
Before and after
The starting point was a scope statement: a list of modules and features. The refinement turned that list into a product: operations start from alarms, sorted by severity; changing a parameter requires confirmation and is recorded; each role sees only its own stores; and technical decisions still pending with the team were documented instead of hidden in the UI.
The performance analysis
The densest screen in the system, in high fidelity: a report per installation that shows the result first and keeps the technical detail right below, organized by equipment.
- 01 / 05
Installation summary
The period, contract and analyzed variables at the top, with the overall performance score in a ring chart and shortcuts to alerts, history, on-call schedule and consumption. Below, the period indicators and the filter by equipment group, with a count for each.
- 02 / 05
Equipment by equipment
Each rack gets a card with its own performance score. The thermodynamic analysis compares condensation, evaporation and superheat with their limits over 24 hours and 7 days, with green, amber and red badges and the trend. The modulation analysis shows how hard each compressor worked.
- 03 / 05
Compressors and condensers
How each compressor and condenser stage ran: time on, total starts and average per hour, which reveal wear and short cycling before they turn into failures.
- 04 / 05
Generate analysis
The analysis is requested in a side panel: client, installation and period, without leaving the current screen.
- 05 / 05
Processing
While the system correlates variables and indicators, the screen shows the report skeleton and a progress bar, so the wait doesn't look like a freeze.
The final MVP screens
The main operations screens in high fidelity, in the same visual system as the performance analysis: white cards, blue for actions and status colors only where there is something to solve.
- 01 / 05
Operations overview
The first screen answers "what do I need to solve now?": active and critical alarms, offline devices, ongoing cases and network performance, followed by the alarm list by severity and stores ranked by their worst status.
- 02 / 05
Alarm center
Filters by severity and status with a count for each, and a table that shows at a glance the equipment, store, who is handling it and how long the alarm has been open.
- 03 / 05
Alarm detail
The current temperature against the allowed range, the chart with the range drawn in the background and the alarm moment marked, the handling timeline and the main actions at the top: acknowledge, open a work order or call the technician.
- 04 / 05
Safe parameter change
The current and new values side by side, confirmation that it's within the model's range, a required reason and a notice that the value will be read back from the controller.
- 05 / 05
Alert on mobile
The notification already states the equipment, store and temperature. When opened, the technician sees the chart of the last hours and can acknowledge the alarm or call the on-call person.
From scope to product
Before the screens, I organized the scope into a product map the team could validate, with the technical rules still awaiting a decision marked as pending.
- 01 / 03
Modules and navigation
The four modules (admin, store/web, mobile app and hardware) and the path people take: client/network → store → equipment → telemetry → alarm → action and history.
- 02 / 03
Alarm center at the heart of the MVP
Operations start from the problems: active alarms, high severity, offline devices and in-progress cases, and a list by severity with store, handling status and how long it has been open.
- 03 / 03
Rules and pending decisions
Parameter security, hardware and connectivity, data and history, per-company access and non-functional requirements, each block with what still needed validation with engineering and clients.
Flow validation in wireframes
The rest of the MVP was validated with the team as editable wireframes before the final visuals: registrations, work orders, reports, preferences and access.
- 01 / 09
Devices and connectivity
Each controller and gateway with online or offline status and the time since the last communication.
- 02 / 09
Store and equipment
Inside the store, each piece of equipment with its status, to go from the network to the faulty freezer in a few clicks.
- 03 / 09
Reports and history
Temperature and events by period, with the allowed range and alarms marked on the timeline, and PDF export.
- 04 / 09
Occurrence and work order
The alarm becomes a service call: priority, assigned technician and a record of the diagnosis and actions taken.
- 05 / 09
Device registration
Name, identifier, store, controller model and connection protocol, linking the physical equipment to the system.
- 06 / 09
Report export
Report type, scope (network, store or equipment), period, CSV or PDF format and data resolution.
- 07 / 09
Alert preferences
Each person's channels (push, e-mail, WhatsApp/SMS) and recipients by severity.
- 08 / 09
Users and permissions
The team with role, unit, last access and status, and an e-mail invitation for users to set their own password.
- 09 / 09
Sign-in
The platform sign-in with a corporate e-mail and the access request, which may require approval.
Mobile app
12 screens for people in the field or at the store: receive the alert, check the chart, acknowledge the alarm, confirm a parameter, follow work orders and notifications.
Navigation flows
Five flows for the clickable prototype: alarms, equipment, service, access and admin/reports.
Architecture
A stack designed for telemetry: lots of data arriving all the time, alerts that can't be delayed and the same back end serving web and app.
- Front end
- React and Next.js with TypeScript, tables and charts for dense reading
- Mobile
- React Native with push notifications (Firebase Cloud Messaging)
- Back end
- Node.js with NestJS, REST API and WebSocket for real-time data
- Data
- PostgreSQL with TimescaleDB for the telemetry time series and Redis with BullMQ for the alarm and notification queue
- Hardware
- Store gateway reading controllers via MODBUS and sending over MQTT, with a local buffer when the internet drops
- Design
- Figma: visual scope, wireframes, high fidelity, components and clickable prototype
Rules the product guarantees
In a system that controls real equipment, some rules can't depend on the interface alone:
- Parameter writes
- Its own permission, explicit confirmation, allowed range per model and read-back from the controller
- Alarms
- Severity, acknowledgement, owner and resolution time, linked to the work order
- Connectivity
- Online/offline status per device and resend of buffered data after an internet outage
- Multi-tenant
- Separate NTC and client roles, data isolation between clients and managers seeing only their own stores
- Audit trail
- A record of who changed each parameter, when and to what value
Visual System
A clear technical look: light gray background, white cards, blue for actions and status colors reserved for what matters (green within range, amber for attention, red critical), so people can spot the problem by color alone.
Palette
Action Blue
#087CFF
Buttons, active filters and links
Performance Green
#13A63B
Within range and performance score
Attention Amber
#A77600
Off target, not critical
Critical Red
#C7292E
Critical alarms and failures
Teal
#0D9488
Service and confirmation actions
Graphite
#1F2B36
Headings and text
Typography
Inter
400 / 500 / 600 / 700
Single typeface: headings, tables and numbers
Takeaways
In dense systems, the UX work is deciding the reading order: the result first, then the reason, the raw data last. Documenting the scope as a product, with pending decisions in plain sight, avoided designing screens on top of rules nobody had validated.
Other projects to explore.
 Citizenship & Immigration
Vogel Cidadania Italiana
Lead generation landing page for an Italian citizenship advisory firm, from UX/UI to React code, with a free assessment form, a leads API and a mobile version
See project SaaS · Inventory Management
Mimos Papelaria
SaaS inventory management system for a stationery store: products, stock movements, categories, suppliers and reports, with UI/UX, a React front end and the back end
See project Healthcare · TypeScript and Node.js
Clinvia
Platform for clinic networks in TypeScript and Node.js: scheduling, online booking, medical records, health plans from authorization to billing and a patient app
See project